Implementation of d/p/q/r functions for xDensity distributions.
dXD(x, xDens, log = FALSE)

pXD(q, xDens, lower.tail = TRUE, log.p = FALSE)

qXD(p, xDens, lower.tail = TRUE, log.p = FALSE)

rXD(n, xDens)
Arguments
| x, q | Vector of quantiles. |
|---|---|
| xDens | Object of class |
| log, log.p | Logical; if |
| lower.tail | Logical; if |
| p | Vector of probabilities. |
| n | Number of observations. |
Value
For the underlying xDensity object, dXD gives the density, pXD gives the distribution function, qXD gives the quantile function and rXD generates n random values.
Details
Extended density (or xDensity) objects provide a compact representation of arbitrary one-dimensional distributions defined on the real line. That is, an xDensity object is a list with the following elements:
xrng,ndens: range and number of gridpoints defining the main density region, i.e.xseq = seq(xrng[1], xrng[2], len = xn).ypdf,ylpdf,ycdf: density, log-density, and cdf on the grid.mean,sd: mean and standard deviation of a Normal distribution to use outside the specified density range.
See also
Examples
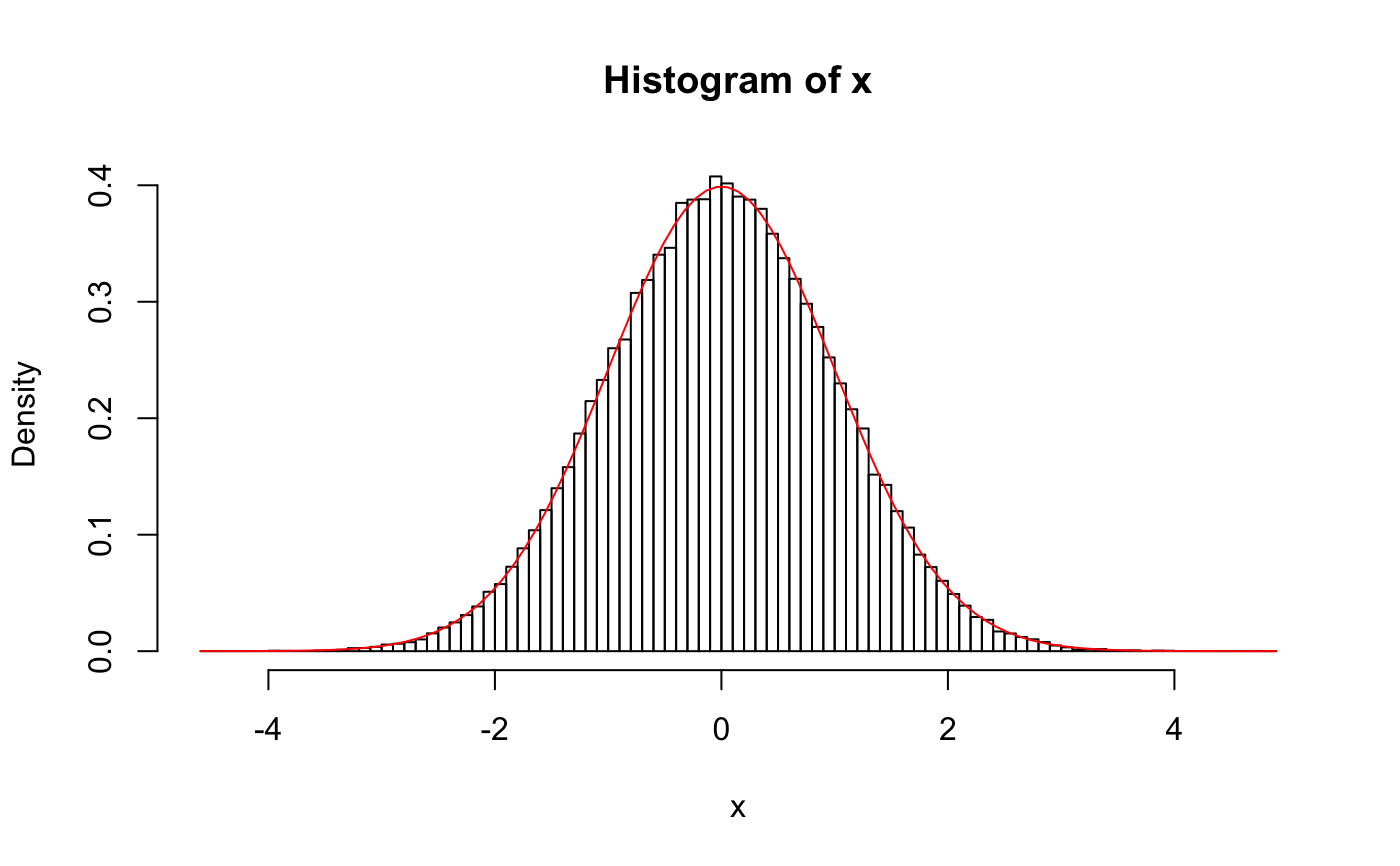
# xDensity representation of a N(0,1) distribution # construct the xDensity object using the known PDF dnorm xseq <- seq(-4, 4, len = 500) # where to evaluate density xDens <- matrixXD(cbind(xseq, dnorm(xseq))) # check random sampling x <- rXD(1e5, xDens = xDens) hist(x, breaks = 100, freq = FALSE)#> [,1] [,2] [,3] [,4] [,5] #> true -1.000109 -1.369717 -1.711516 -1.009958 -1.770372 #> xDens -1.002504 -1.373909 -1.710871 -1.009187 -1.772558#> [,1] [,2] [,3] [,4] [,5] #> true -1.068552 -0.1877551 -2.263269 -1.094182 -2.343858 #> xDens -1.068550 -0.1877586 -2.263223 -1.094173 -2.343812#> [,1] [,2] [,3] [,4] [,5] #> true -0.1932449 0.8129345 0.5756194 0.3169434 -0.07806913 #> xDens -0.1932441 0.8129474 0.5756196 0.3169472 -0.07806937
