Construct an xDensity representation of a combined Box-Cox/Gram-Charlier density approximation.
Source: R/gc4XD.R
gc4XD.RdConstruct an xDensity representation of a combined Box-Cox/Gram-Charlier density approximation.
gc4XD(x, lambda = NULL, alpha = 0, cmom = NULL, trim = 0.01,
  n = 512, from, to, mean, sd, ...)
Arguments
| x | Vector of random samples from density to approximate. |
|---|---|
| lambda | Exponent of Box-Cox transform. If |
| alpha | Offset of the Box-Cox transform. Default is no offset. See Details. |
| cmom | Optional vector of first 4 central moments of |
| trim | Scalar between 0 and 1; removes the |
| n, from, to | Specifies a grid of values on which to evaluate the density (see |
| mean, sd | Optional mean and standard deviation for |
| ... | Additional parameters to Box-Cox fitting function |
Value
An xDensity object.
Details
x is first standardized to z = x/sd(x) - min(x/sd(x), from) + 1, before the Box-Cox transform is applied.
For details on the Box-Cox transformation and Gram-Charlier approximation, see powFit and dgc4 respectively.
See also
Examples
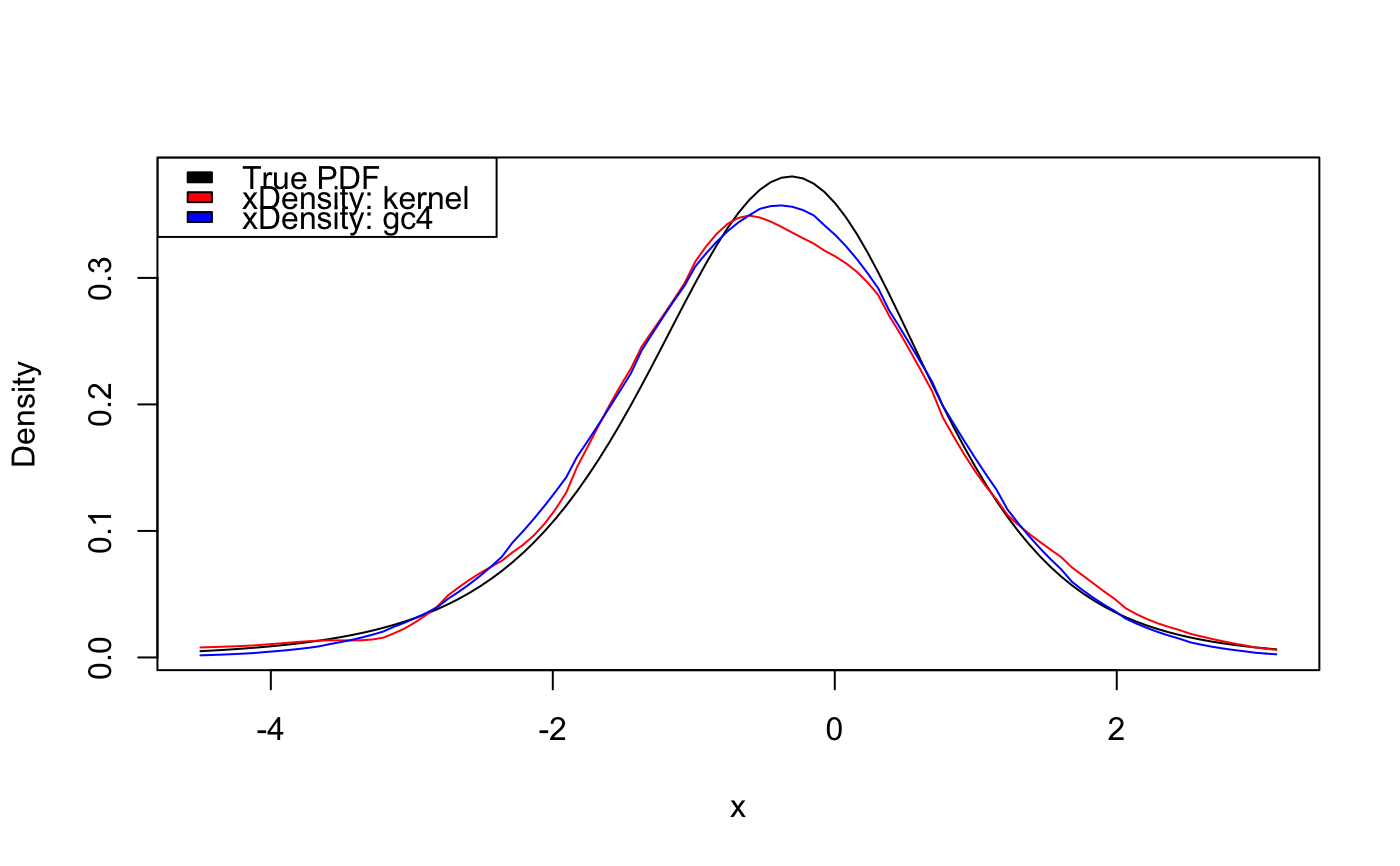
# xDensity approximation to a noncentral-t distribution # true parameters lambda <- rnorm(1) # noncentrality parameter nu <- runif(1, 4, 6) # degrees of freedom # simulate data (note the small sample size) x <- rt(500, df = nu, ncp = lambda) # xDensity approximation xDensK <- kernelXD(x) # kernel smoothing xDensG <- gc4XD(x) # gc4 approximation # true vs approximate PDFs xlim <- qt(c(.005, .995), df = nu, ncp = lambda) # range for plot curve(dt(x, df = nu, ncp = lambda), from = xlim[1], to = xlim[2], ylab = "Density")legend("topleft", legend = c("True PDF", "xDensity: kernel", "xDensity: gc4"), fill = c("black", "red", "blue"))