Construct an xDensity representation of a known distribution.
matrixXD(XY, mean, sd)
Arguments
| XY | 2-column matrix representation of a univariate density. The first column is a grid of x values giving the centers of bins. The second column are the corresponding densities. |
|---|---|
| mean, sd | Optional mean and standard deviation of the Normal distribution to use outside the grid values in |
Value
An xDensity object. See xDensity.
Examples
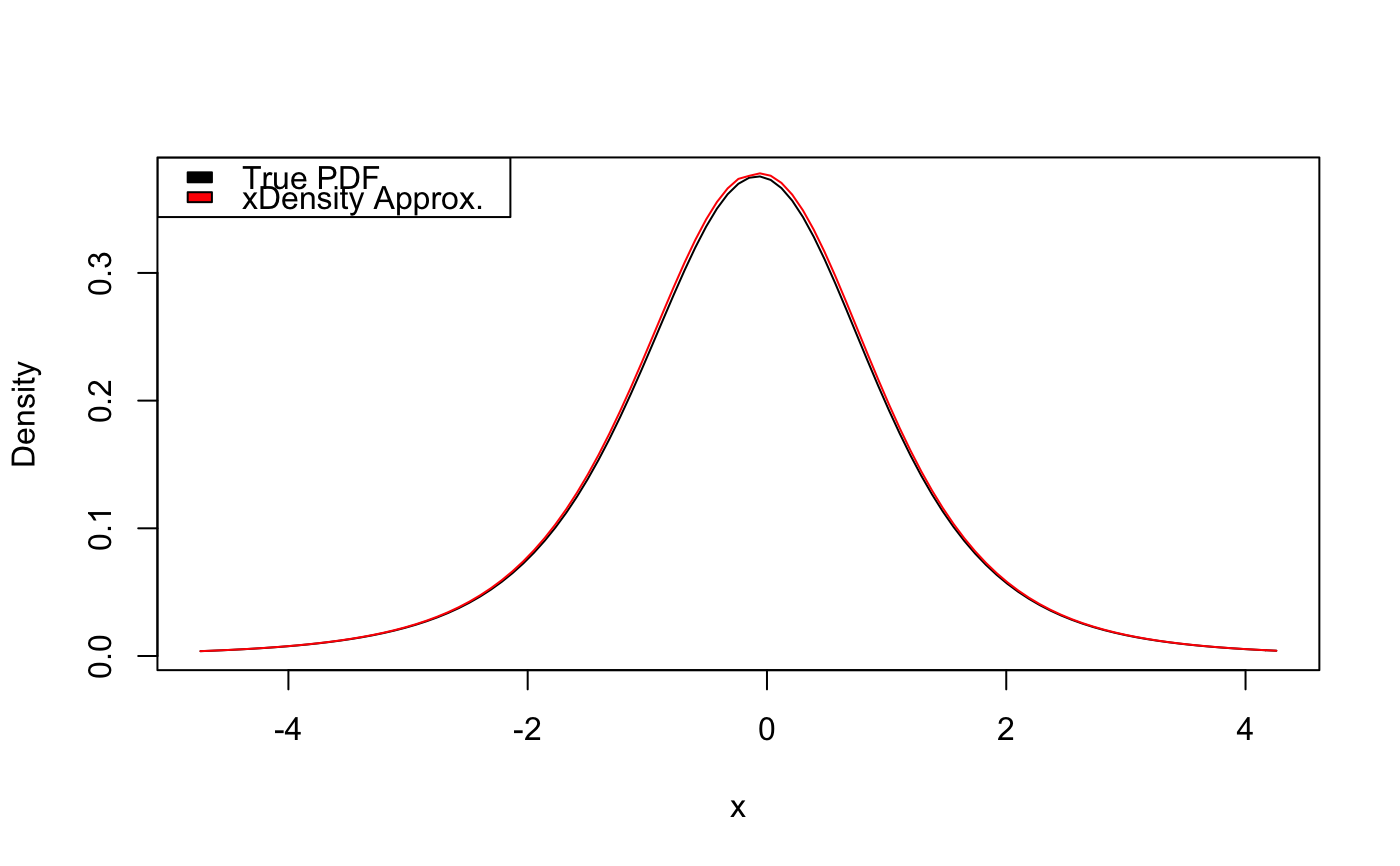
# xDensity approximation to a noncentral-t distribution # true parameters lambda <- rnorm(1) # noncentrality parameter nu <- runif(1, 4, 6) # degrees of freedom # xDensity encoding of known PDF xlim <- qt(c(.005, .995), df = nu, ncp = lambda) # discretization range xseq <- seq(xlim[1], xlim[2], len = 200) # where to evaluate density xDens <- matrixXD(cbind(xseq, dt(xseq, df = nu, ncp = lambda))) # true vs approximate PDFs curve(dt(x, df = nu, ncp = lambda), from = xlim[1], to = xlim[2], ylab = "Density")